Signals operator view and Kibana panel
The Signals operator view provides system operators with a quick, actionable overview of the active watches and their current statuses. Unlike the traditional watch overview (used mainly by users who create and maintain watches), the operator view is designed for monitoring and responding to alerts and issues as they arise.
Note: Watches will only appear in the operator view if they define severity levels. The operator view then displays the watches ordered by severity level, highest severity first. In addition, watches which encounter errors during execution, will be displayed above all other watches.
Columns and actions
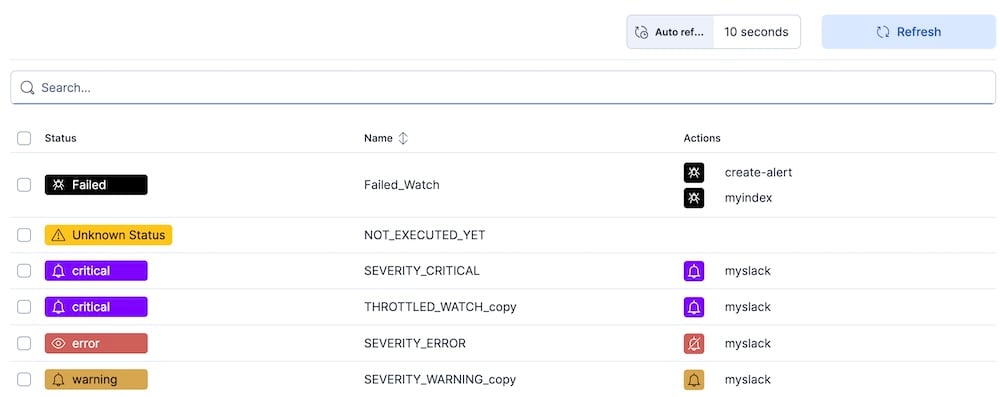
The operator view consists of three columns:
- The “Status” column displays the severity status and the status of actions that were executed due to the severity status. See the chart below for the possible severity statuses and their color codes. The icon at the left side of each entry represents the action status: A bell indicates that an action has been executed. A striked-through bell indicates that all action executions have been suppressed, as the watch severity status has been acknowledged by the user. Clicking on the bell will acknowledge the whole watch, including all actions.
- The “Name” column displays the name of the respective watch.
- The “Actions” column displays an icon for each action defined for a watch. This allows you to see which actions have been executed, and which actions have not been executed (due to the associated severity level or acknowledgement status). Clicking on the bell icon next to an action name will acknowledge the individual action, without acknowledging the whole watch. An acknowledged watch is displayed with a strike through bell.
By default the operator view is refreshed every 10 seconds, this can be disabled or set to a different time period using the “Auto refresh” icon.
The severity levels are color coded as follows:
not yet executed: yellowexecuted successfully: greenpaused: greyinfo: Light graywarning: Ambererror: Redcritical: Violetfailed(action/execution): Black
External references
It is possible to externally link or embed certain configurations of the operator view. For this, a number of URL query parameters are provided which control the displayed watches:
-
query: The displayed watches will be restricted to the ones where watch name or watch id match the given query. You can also use wildcards, for examplewatch_*. -
sortDirection: the sorting of the watches (asc or desc). -
pageIndex: the page number (first page is 0). -
pageSize: the number of watches displayed on each page. The default is100(options are10,20,50or100).
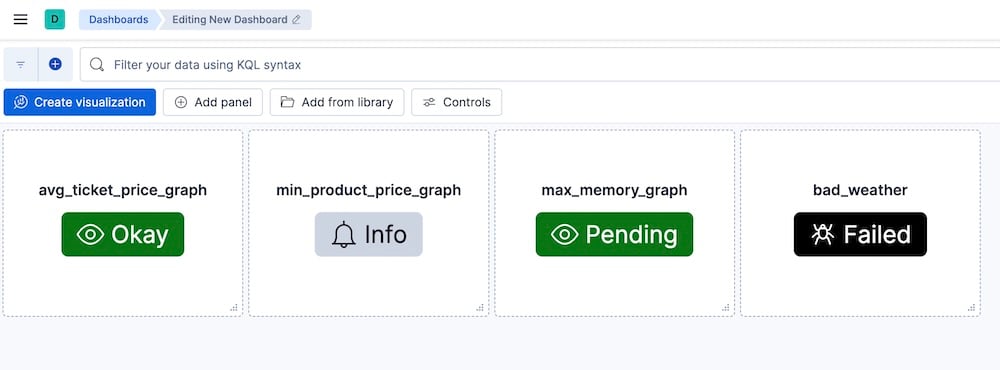
Kibana dashboards integration
Signals provides a custom Kibana panel which can be used to display the severity status of a watch in a dashboard. In order to add such a panel to a dashboard, click on “Add Panel” button in the edit dashboard view and choose “Add Signals watch”. The panel will display the current severity status of the respective watch with the same color codes as the operator view.